Saturday, October 11, 2014

GIS with R

Initially I tried QGIS, thinking that a system using a GUI interface would be quicker than one where you have to code and spend time figuring out syntax and data structures. WRONG! After crashes and a frustrating attempt to create a heat map, I switched to using R. Yes, figuring out which libraries to use and understanding the syntax took time, but I found it was still faster than trying to use QGIS.

I overlaid the Google maps image of San Francisco with the Police Districts shapefile, then colored the districts based on the frequency of violent crime in the area. The piece that took the most time was putting the district names at the center of each district, because I couldn't figure out how to get the latitude and longitude of shapefile centers. Eventually StackOverflow came to my rescue: http://stackoverflow.com/questions/16462290/obtaining-latitude-and-longitude-with-from-spatial-objects-in-r


San Francisco PD Department Shapefile: https://data.sfgov.org/Public-Safety/SFPD-Districts-Zipped-Shapefile-Format-/8yyx-6uur

Here's the R Notebook: http://rpubs.com/LukasHalim/28754


I also did some non-GIS analysis, to whether crimes are reported more at certain times, which crimes are reported most frequencly, and whether certain Police Districts have a higher proportion of unresolved incidents.

Crime Frequency

Crimes by Hour


Monday, September 15, 2014

Frugal Grocery Shopping in West Hartford

I'm trying to cut our grocery bill - August came it at over $600 for two adults, and that doesn't even include several restaurant trips. This Friday I visited AppleTree and Aldi and came home with the following haul:

AppleTree

ItemUnit CostCost
Packham Pear.99/lb3.4
Black Plum.99/lb1.71
Green Squash.99/lb3.86
Nectarines.99/lb3.69
Loose Beets.79/lb3.17
Yam.99/lb2.72
Lettuce1.99/lb1.19
Peppers1.59/lb6.03
Green Cabbage.99/lb2.32
Fuji Apples.99/lb4.18
Carrots.69/lb1.08
Romain Lettuce1.79/lb1.2
Total34.55


Aldi

ItemPrice Per UnitQuantityPrice
Corned Beef Hash1.5911.59
Frozen Peas0.9521.9
Avocados0.8943.56
33.9 oz Coffee5.4915.49
Whole Chicken5.415.4
Flowers3.9913.99
Eggs1.2933.87
Gallon Whole Milk2.8912.89
Subtotal28.69
Total with Tax29.04

Thursday, August 8, 2013

Preparing for the Base SAS Certification Exam

I tried studying for the SAS exam using Anki decks, but I found that this wasn't a very effective way of learning the syntax.  So, I tried a different strategy: going through the SAS Certification book and writing code snippets related to each concept.  The certification test questions frequently want you to spot errors, so I have created snippets to illustrate frequent mistakes as well as correct code.  When possible, I used the datalines feature to make very small data sets (a few rows are usually enough to illustrate the concept).

The code is available on GitHub: https://github.com/lukashalim/SASCert

Tuesday, July 16, 2013

Amazon Free Tier expiring? Too cheap for EC2? Need root? Head to Low End Box.

I didn't want to start paying \$12 a month for and EC2 micro instance, so I did some googling and found a link through Low End Box to a company called Reliable Hosting Services offering a virtual server for $3/month. Obviously it doesn't have the same feature set as EC2, but it's good enough for me for now.

Similar offers are available on http://www.lowendbox.com/.

Saturday, July 13, 2013

Different Uses of SUM in SAS

There are at least four different types of SUM I have run across in SAS:

  • In PROC PRINT
    • The SUM statement, which causes PROC PRINT to display totals for the specified variable
  • In the DATA step
    • The sum statement, which adds a specified expression to an accumulator variable.  The value of the accumulator variable is retained through each iteration of the data step.  The sum statement treats missing values as 0.
    • The + operator.  This adds two numeric values, but if either value is missing the expression will evaluate to missing.
    • The SUM function - this taks the form SUM(val1, val2, ...), returning the sum of the values, treating missing values as zero.
In PROC PRINT, SUM variable-name will give you the total value, for example:

PROC PRINT DATA=work.grocery;
  var item;
  sum price;
run;

Obs Item Price
1 Milk 3
2 Tofu 4
3 Bread 5
12

On the other hand, in a DATA step, you have the sum statement variable+expression.  This initializes the value of variable to 0 and increment by expression in each iteration of the DATA step.

The SUM function and + operator have the same results, except in the case of a missing value.
MyVar = SUM(Var1,Var2); 
MyVar = Var1 + Var2,
 Will produce the same result, unless Var1 or Var2 is a missing value.  If, for example, Var2 is missing, then the SUM function will return the value of VAR1, while the + operator will return the value missing.  This is particularly confusing because the sum statement also uses the + symbol, but the sum statement treats missing values as zeros.


Wednesday, July 10, 2013

Study Strategy for the Base SAS Certification Exam


  • Take the through the end-of-chapter quizzes in the SAS® Certification Prep Guide: Base Programming for SAS® 9, Third Edition
  • When to you get a problem wrong, use the explanation or (when necessary) the material in the chapter to create an Anki flashcard.
    • Often, creating a cloze deletion flashcards works well.  For example, the explanation, "Librefs must be 1 to 8 characters long, must begin with a letter or underscore, and can contain only letters, numerals, or underscores. After you assign a libref, you specify it as the first level in the two-level name for a SAS file." can be come "Librefs must be [...] to [...] characters long, must begin with a [...] or [...], and can contain only [...], [...], or [...]."  Doing this will create 7 flashcards, one with each deleted phrase.
    • Other times, basic flashcards work well.  For example, chapter 3 in the certification guide lists a number of common SAS coding mistakes and there associated symptoms.  Each symptom can be the front of a flashcard, and each symptom can be the back of a flashcard.
  • My tendency when coding is to write the first thing that comes into my head, knowing that the syntax will probably be a bit off and that I'll have to fix a few errors before the code will run.  The SAS certification exam requires that I be able to read some code and figure out which snippets have syntax errors, which will run normally, and which will run but have logical errors that will cause incorrect output.  It's a hassle, but if you want to become really proficient with a language I think it's good to have practice looking at lines of code and detecting which will error and which will run properly.

Thursday, June 20, 2013

Avoid Online Distractions

Based on the information here, I decided to add StayFocused to Chrome.  You tell StayFocused which websites you want to limit, and set a maximum time allowed on those websites.  Definitely helpful for limiting the time I spend on facebook & feedly.  One really nice feature: if you wish to extend your time, you get an irritating task to complete - for example, retyping a long paragraph character for character.  This puts up a sufficient barrier to prevent you from accessing content when you don't need to, but allows you to log in if when you really need to - for example, if you received an important message on facebook.
http://www.wikihow.com/Avoid-Distractions-Online#Tips

Tuesday, May 28, 2013

Dot Plots with pgfplots

I did some more tweaking and came up with this:

Much better, huh?  Here's the code... if you use it replace the "\\" with just "\"
\\begin{figure}
\\beginpgfgraphicnamed{dot_test}
% Preamble: \\pgfplotsset{width=7cm,compat=1.8}
\\begin{tikzpicture}
\\begin{axis}[
ymin=-.3,
ytick=\\empty,
x tick label style={major tick length=0pt}
] \\addplot+[only marks,mark=*] plot coordinates
{(0,3) (0,2) (0,1) (0,0) (1,0) (1,1) (1,2) (2,0) (2,1) (2,2) (2,3) (2,4) (3,0) (3,1) (3,2) (3,3) (4,0) (4,1) (4,2)};
\\end{axis}
\\end{tikzpicture}
\\endpgfgraphicnamed
\\end{figure}

Monday, May 27, 2013

Making Plots

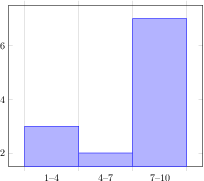
As I mentioned before, I've been using Asymptote to generate geometrical figures, but I also would like to create nicely formatted plots - bot plots, dot plots, and histograms - with minimal effort.  I found a few options:

  • Asymptote does have a graphing library,  and it would be nice to not have to learn yet another tool.  However, I couldn't see how I could make it format things in the way I'd like.  For example, I'd like my histogram to have labels showing the range of values for each bin.  I think Asymptote is outstanding as a tool for general technical drawing, and it can certainly do graphing, but creating histograms, bar charts, and dot plots, I think that specialized tools (such as those below) will be more effective.
  • http://matplotlib.org/ - a python library
  • http://pgfplots.sourceforge.net/ 
    • creates histograms, box plots (shown in section 5.9.1 of the manual and in this question on tex.stackexchange).  
    • Getting dotplots in the format I'd like will take some doing... you basically use the scatterplot function to stack dots on top of each other.  Should probably move the x-axis labels further down, remove the y-axis labels, and obviously add a point at (2,2), but you get the general idea: 
    • It is possible to create a PDF that contains just the plot, using the directions in 7.1.2 of the manual: "Using the Externalization Framework of PGF 'By Hand'."  
  • R - 
    • Easy to export R graphs to PDF or PNG, though I was thrown off by the fact that some code that works to export to an PNG when executing line-by-line doesn't work when executing within a loop (see the ggplot2 section here)
    • When I tried to the image smaller, I ended up with a funny image where the fonts were disproportionately large.  I'm not sure how much effort would be necessary to fix this.  
    • The ggplot2 package does have a nice dotplot feature... with very little futzing I was able to produce this:
    • I want to write a loop that will create a whole bunch of random plots and write the related information (mean, median, range) to the database.  It took me a while to figure out how to configure the ODBC database connection to MySQL - you have to make sure that everything is either 32-bit or 64-bit, otherwise R throws the error: [RODBC] ERROR: state IM014, code 0, message [Microsoft][ODBC Driver Manager] The specified DSN contains an architecture mismatch between the Driver and Application.
Decision: In the end I think pgfplots is the quickest way to produce nicely formatted images of the desired size.

Thursday, May 23, 2013

Bogus Criticism of the Common Core

Here's a popular post at The Atlantic, criticizing the Common Core math standards.  The author approvingly quotes an email from a math teacher:
I am teaching the traditional algorithm this year to my third graders, but was told next year with Common Core I will not be allowed to. They should use mental math, and other strategies, to add. Crazy! I am so outraged that I have decided my child is NOT going to public schools until Common Core falls flat.
They can't use the standard algorithm, but instead must resort to "mental math" and "other strategies"?  Hmmmm... let's take a look at the standards for third grade, available at www.corestandards.org:
CCSS.Math.Content.3.NBT.A.2 Fluently add and subtract within 1000 using strategies and algorithms based on place value, properties of operations, and/or the relationship between addition and subtraction.
Please notice that this does not forbid the "standard algorithm" for addition.  Rather, as I read it, this means that the standard algorithm can be taught, but it must be taught with reference to place value, properties of operations, and/or the relationship between addition and subtraction.  When we, for example, do \(17+24\) we recognize that that 17 is composed of one ten and seven ones, while 24 is composed of two tens and four ones.  We can add numbers in whatever order we like without changing the result, but if we are doing the standard algorithm we begin by adding the four and the seven, \(4+7\), which gives us 11, or one ten and one one.  We then add the tens (one from 17, the two tens from 24, and the ten from 11) to get \(10 + 20 + 10\) to get 40.  Our final result is 41.  This can be shown in the standard algorithm using the standard way of writing things it (with one number on top of the other, lining up the tens and the ones), but we don't use terms like "carry" and  we make sure to remind students that the first 1 in eleven is not "1" but rather "1 ten."

So, I don't think the teachers complaint is even slightly legitimate.  However, I do think it points to a real question - will the common core be implemented correctly?  Will teachers get the misimpression that they must stop teaching the standard algorithm?  As far as I can tell, the mathematics core standards are far better than the prior standards, but will the standards be used in a way that will improve the quality of math education?

Wednesday, May 22, 2013

6th Grade Common Core Math Worksheets:


These are the ones I've put together so far:

  • Ratios & Proportional Relationships
    • A.1 Describe a ratio relationship between two quantities
    • A.2 Use rate language in describing ratio relationships
    • A.3 Solve problems using ratio and rate reasoning
  • The Number System
    • B.2 Divide multi-digit numbers
    • B.3 Add, subtract, multiply, and divide multi-digit decimals.
    • B.4 Find the gcf and lcm. Use gcf to factor the sum of two integers.
  • Expressions & Equations
    • A.1 Expressions with whole-number exponents.
    • A.2 Write, read, and evaluate expressions in which letters stand for numbers.
    • A.3 Apply the properties of operations to generate equivalent expressions.
    • A.4 Identify when two expressions are equivalent.
    • B.5 Determine whether a given number makes an equation or inequality true.
    • B.6 Write expressions using unknown variables to solve real world problems
  • Geometry
    • A.1 Find the area of regular polygons
    • A.2 Find the volume of rectangular prisms.
The most current version can be found here: http://www.mathtestnow.com/problem_index.php

Making my site crawlable

My site does terribly when I google it.  I realized there are a few major problems:
  • I haven't done the extra work necessary to get Google to index AJAX content
  • Most of the site's content is behind the login, so the bots can't find it.
  • Using JavaScript redirects rather than <a href="URL">link</a>
  • Solution:
    • Make sure that all the pages I want indexed can be reached via a simple href link that does NOT require login.  
      • As they explain here  buttons using javascript can be changed so that they are really links which are simply styled as buttons.
    • Create a large repository of static content that does not require a login.  Direct traffic to this.

Tuesday, May 21, 2013

Updates to MathTestNow

I haven't been doing regular updates on my progress with MathTestNow.com, but things are moving along:

  • Posted sample worksheets to TeachersPayTeachers.  I plan to make some free and some $1.
  • Got some really wonderful help from a guy at StackOverflow about how to make AngularJS and MathJax play nicely together.
  • Had a friend who is a math teacher take a look at the website - made me realize that I had a number of issues with the user interface on the main page.
  • Creating more question types and improving existing ones.
  • Creating sample worksheets for each content area.
  • Redoing some of the image files that were too large
  • Having trouble formatting the PDFs when there are images.  Asked a question at http://tex.stackexchange.com

Wednesday, May 15, 2013

Final Project for Coursera "Passion Driven Statistics"

Title - The Association Between Marital Status and Voting in the 2000 Election

Introduction
Many factors are thought to have an impact on voting.  Racial, cultural and religious identity may all play a role, as well as views on economic, social, and foreign policy.  One of the factors which may be associated with voting patterns is marital status.  Since non-married people do not have a spouse to fall back on in case of a job loss, pregnancy, or disability, they may be more keenly aware of the need for government assistance and therefore more likely to vote for a larger social welfare state, and therefore for the Democratic candidate.  If this hypothesis is correct, non-married (widowed, divorce or single) people who are caring for children are even more likely to feel the need for a large welfare state, and therefore perhaps more likely to support the democratic candidate.

Research Questions
  1. For independent voters who voted in the 2000 election, are nonmarried people (single, widowed, divorced) more likely to vote for the democratic candidate?
  2. Is the association between marital status and voting similar for individuals with and without a child under 18 at home?
Methods
    Sample - The 1987 to 2012 Values Merge File contains core values questions from 15 surveys conducted between May 1987 and April 2012, some of which were done face-to-face and some over the telephone.  The combined N=35,578.
    Measures - Data for voting, marital status, and dependent at home were based on telephone or in-person responses.  We filtered out follwing: those who were not asked about whether htey had kids at home, those who did not vote for either the republican or the democrat, and those who were affiliated with either the republican or the democratic party.  In other words, we are looking only at those who voted but did not have an affiliation with either political party.  For marital status, we converted the data so that the values are either married, not married, or did not respond.

Results
    Univariate - Independents (those not identifying as Republican or Democrat) who voted for a non-third party candidate in the 2000 election voted for the Democrat 40.26% of the time.  63.6% of the sample was married, and 31.29% reported having kids living at home.

    Bivarite - As expected, the chi-squared analysis shows that nonmarried (single, widowed, divorced) are more likely to vote for the Democratic presidential candidate - in our sample, 46.85% of married voted for the Democrat, while 58.73% of unmarried voted for the Democrat, and the chi-squared test has a p-value below .001.  When we look at those with and without kids, we see that for both married and unmarried, those with kids at home under 18 are less likely to vote for the Democrat than those without.


Discussion
These results confirm the well-known pattern that non-married people are more likely to vote for the Democrat than married people.  Further, they show that those without kids at home are more likely to vote for the Democrat than those with kids at home.  However, we do not know much about the causality - are Democratic voters less likely to marry?  Or does marriage cause a change in voting patterns?  This study does not give sufficient evidence to make a determination.  Also, this study only looks at the 2000 election, so the result might not generalize to other election years.  

For future research, it would be good to look at a wider array of demographic features, to see whether marital status was the best predictor to look at, or whether a different indicator (correlated with marital status) would better predict voting patterns.  It would be also interesting to look at the same voters across time - if someone moves from single status to married or from married to divorced or widowed, does this change cause a change in voting?

Thursday, May 2, 2013

Coursera - Passion Driven Statistics Assignment 2: Frequency Tables

I'm taking another MOOC - Passion Driven Statistics!  Mostly I chose it because it the class includes free access to SAS OnDemand.  SAS training is ridunkulously expensive... the listed price for the the course SAS Programming Introduction: Basic Concepts is currently 1100, and the combined cost for the two courses they recommend as preparation for the base certification come to around $3.5K.  So why not get some training for free with Coursera?


Anyway, I'm using some data published by Pew.  The data was in SPSS format, but it's easy to import to SAS.  Here is my code & output for the second assignment:


Code
libname mydata "/courses/u_coursera.org1/i_1006328/c_5333" access=readonly;

data new; set work.VALUES_MERGE; 

/*Change labels for race and education */
LABEL RACETHN="Race and Ethnicity"
EDUC="Last Grade Completed";
/* include only those who always or nearly always vote */
IF OFTVOTE <= 2;
/* Exclude all who did not vote or voted for a 3rd party */
IF PARTY > 2; 
/* Exclude those who didn't vote for a major party candidate */
IF PRESVOTE <=2; 

/*Treat Don't Know / Refused to answer as missing data. */
IF RACETHN = 9 then RACETHN = .;
IF PARTY=9 THEN PARTY = . ;
IF EDUC=99 THEN EDUC = . ;

/* Let those who voted for the dem be 0, those who voted for repub be 1.
This will allow us to see % repub by doing an average of PRESCATEGORY*/
IF PRESVOTE = 1 then PRESCATEGORY=0;
ELSE IF PRESVOTE = 2 then PRESCATEGORY=1;


PROC SORT;  by respid;

/* create the frequency tables */
PROC FREQ; TABLES OFTVOTE RACETHN EDUC PARTY;

Output
The FREQ Procedure
How often do you vote?
oftvoteFrequencyPercentCumulative
Frequency
Cumulative
Percent
Always386655.74386655.74
Nearly always307044.266936100.00
Frequency Missing = 258
Race and Ethnicity
racethnFrequencyPercentCumulative
Frequency
Cumulative
Percent
White Non-Hispanic608485.39608485.39
Black Non-Hispanic4696.58655391.97
Hispanic3144.41686796.38
Other Non-Hispanic2583.627125100.00
Frequency Missing = 69
Last Grade Completed
educFrequencyPercentCumulative
Frequency
Cumulative
Percent
8th or less1632.271632.27
Some H.S.3294.594926.86
H.S. Grad189926.48239133.34
Tech/Trade3344.66272537.99
Some College180425.15452963.15
College +264336.857172100.00
Frequency Missing = 22
Party Identification
partyFrequencyPercentCumulative
Frequency
Cumulative
Percent
Independent652293.21652293.21
No preference3715.30689398.51
Other party1041.496997100.00
Frequency Missing = 197

Thursday, April 25, 2013

What have I learned so far?


  1. Getting people's attention on the internet is very difficult.  Try posting a lync on a Google+ community that you think matches your target audience and see how many people visit your site as a result.  Probably one or two people at most.  If you're going to paid route, it might be tempting to go with a service offering a lower cost-per-click than GoogleAdwords, but in my limited experience the less expensive services provide lower quality traffic.  Now I see why so many sites offer free content to attract attention.
  2. SEO is easier for static content then for dynamic content.  There are some amazingly ugly websites - poorly laid out and with tons of ugly ads, that do quite well.  Try googling "middle school math" and you'll notice that the first hits are just pages of links to other content.
Combining facts (1) and (2), I'm thinking that for my website, it would be best to create some static content that is free and open to the public.  In my particular case, I will use my web app to create some freely available HTML & PDF math worksheets.  Easier for Google to crawl (though it is possible to get Google to crawl JSON), and (just as important) other sites are much more likely to want to link to free content.... more links means improved search results.


Wednesday, April 24, 2013

Nice usability checklist

http://userium.com/index.html

Looking for beta testers!

I'm looking for math teachers who would like to use a web app to creates quizzes, tests, and worksheets aligned to the common core standards.  If you are interested in being a beta tester, please email me - I'm on gmail at lukas.halim.  If you're willing to try the site and provide feedback, I'll send you a $10 Starbucks gift card for your trouble.

Experimenting with Paid Advertising

I'm currently experimenting (meaning small amounts of $$$) with using the following paid advertising sites to direct traffic to www.mathtestnow.com:
  • Google AdWords.  Google is ubiquitous but, as this article explains, it also tends to be expensive.
  • BidVertiser.  I just put in a request with them today.  They offer a 20 dollar free credit (if you enter your paypal info), so I figure I have nothing to lose.  One thing I dislike about them - they offer a "Toolbar creator" - in my opinion those things are basically malware.
I haven't tried these yet, but I probably will:
  •  Outbrain.com: http://www.outbrain.com/ - it looks as though they focus on written content rather than webapps, so this may not be a good fit.
  • Virurl: https://virurl.com/ - it sounds like a decent concept, but my experience with it was very similar to this post, Is VirUrl Just a Haven For Click Fraud and Bots?  The cost-per-click is vastly less expensive than Google Adwords, but the quality of the clicks appears to somewhere between garbage and fraudulent.
Perhaps I should also try http://www.usertesting.com/, recommended by someone on quora.

Also, Google still hasn't crawled the site.  Given how much AJAX there is, I prbably need to read Google's article on how to make AJAX data crawlable and this stackoverflow explanation.

Finally, Udemy has a useful article on how to find beta testers.  In particular, I should try to find beta testers on the common core forums.

Tuesday, April 23, 2013

Progress

I'm continuing to work on www.mathtestnow.com.  Today I've mainly been focusing on cosmetic changes and getting the site indexed.  Here are a few specifics:

  • Allow users to switch from the logon page to the registration page without doing a page refresh.  Changes were made here: www.mathtestnow.com/user/index.php
  • Fixed a problem where the most recently added equation was not formatted by MathJax.  Added a pause after updating the AngularJS model but before calling the MathJax.
  • Trying to make it easier to understand what you are supposed to do when you come to the test creation page.  Previously you can only see one dropdown, but I changed it so that there is a pre-selected option... I think that makes it clearer how the thing works.